I banged my head against a while for a while learning to share drone data in Mapbox and, now that I've got everything figured out, think it is a lot of fun and I thought I would share lessons learned on DIYD. Unfortunately, running JavaScript from within a blog post is non-starter, so you will have to cruise over to my blog to check out how some of these things actually work. All of the images here are just static representations of the interactive maps.
Autonomous flying vehicles capture all kinds of interesting GIS data–photos, projected photos, and flight logs, to name a few. Furthermore, drone imagery can be processed into other GIS data products like orthomosaic images and point clouds that become infinitely more valuable when combined with traditional GIS data sources like property boundaries and civil engineering diagrams. That said, sharing these data off-line is quite challenging. Massive geotiffs are painful to open in heavy GIS software like ArcMap and QGIS, individual images are troublesome to keep track of when not associated with a map, and flight logs are near useless in their raw .tlog or .bin form. Our friends at Mapbox have assembled an incredible (and free up to a substantial quota) toolkit for sharing all of these data in a simple webview format.
Follow these instructions to create an interactive map showcasing your drone data like the one below, whose source code is available at https://github.com/dmckinno/Mapbox. For this particular example, I overlaid a property boundary and fantastical building footprint kmls, an orthomosaic geotiff, and a handful of images viewable by clicking on the location at which they were taken, but essentially any GIS vector or raster data are sharable using Mapbox.
- Create an account over at https://www.mapbox.com/studio/signup/.
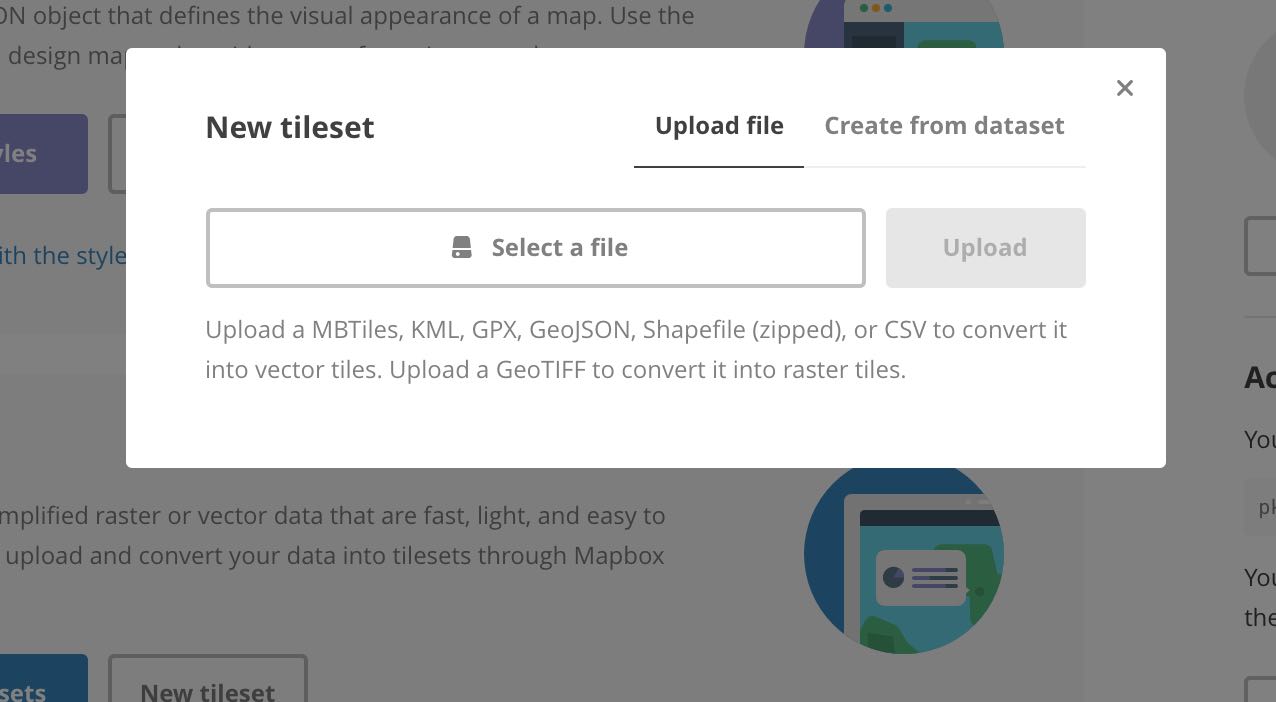
- Open Mapbox Studio. If you are not interested in adding interactivity to your maps, you can share all of your drone data without writing a single line of code. Simply upload your data a a tileset and add your tileset to a style
.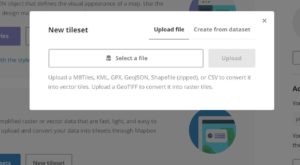
Mapbox accepts raster data in the geotiff format and vector data in the kml, which can be generated from Arducopter .tlogs using Mission Planner, gpx, which is the standard output from handheld GPS devices, GeoJSON, a GIS standard that is easily passed between systems, .shp, an open ESRI format, and .CSV formats. After uploading any of these file formats, Mapbox will slice the data into either vector or raster tiles that can be beautifully navigating on the web.
Note you are unable to display a single nadir photo or a point cloud using Studio. To display a single nadir image in Mapbox, you must write a few lines of JavaScript (see below for examples). If you would like to display a point cloud, you must first use laslib or a commercial tool like ArcMap to convert to a geotiff.
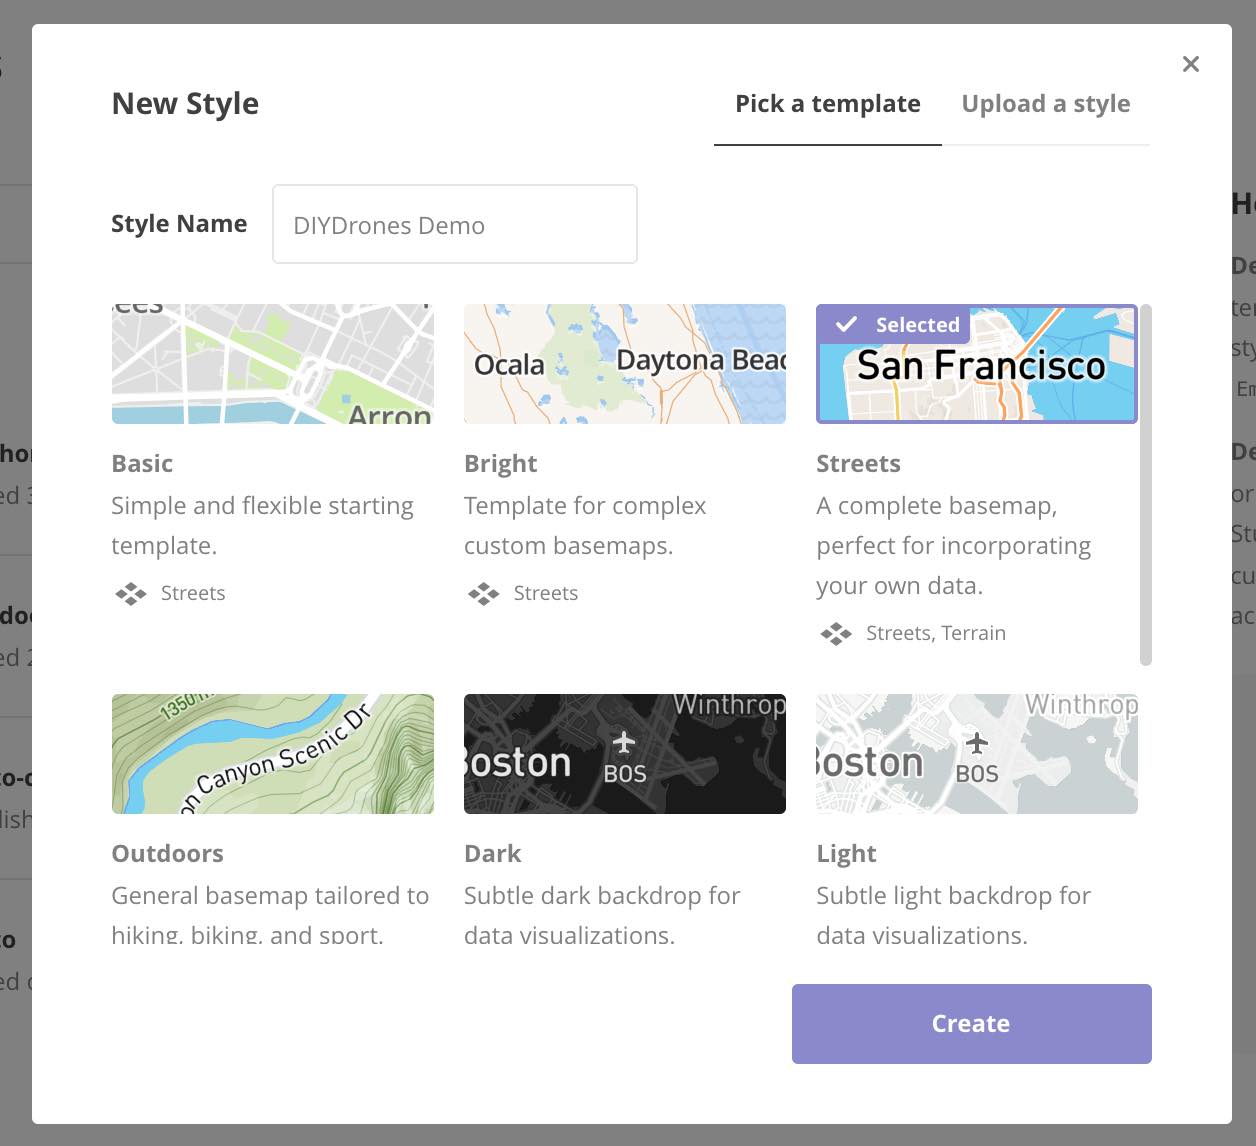
Once you have uploaded your tileset, create a new Style.
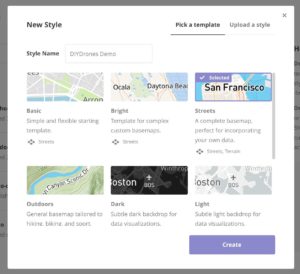
Choose the desired basemap, add your tileset(s) to the map, and click “Publish.”
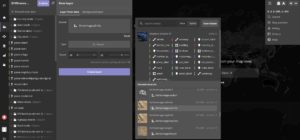
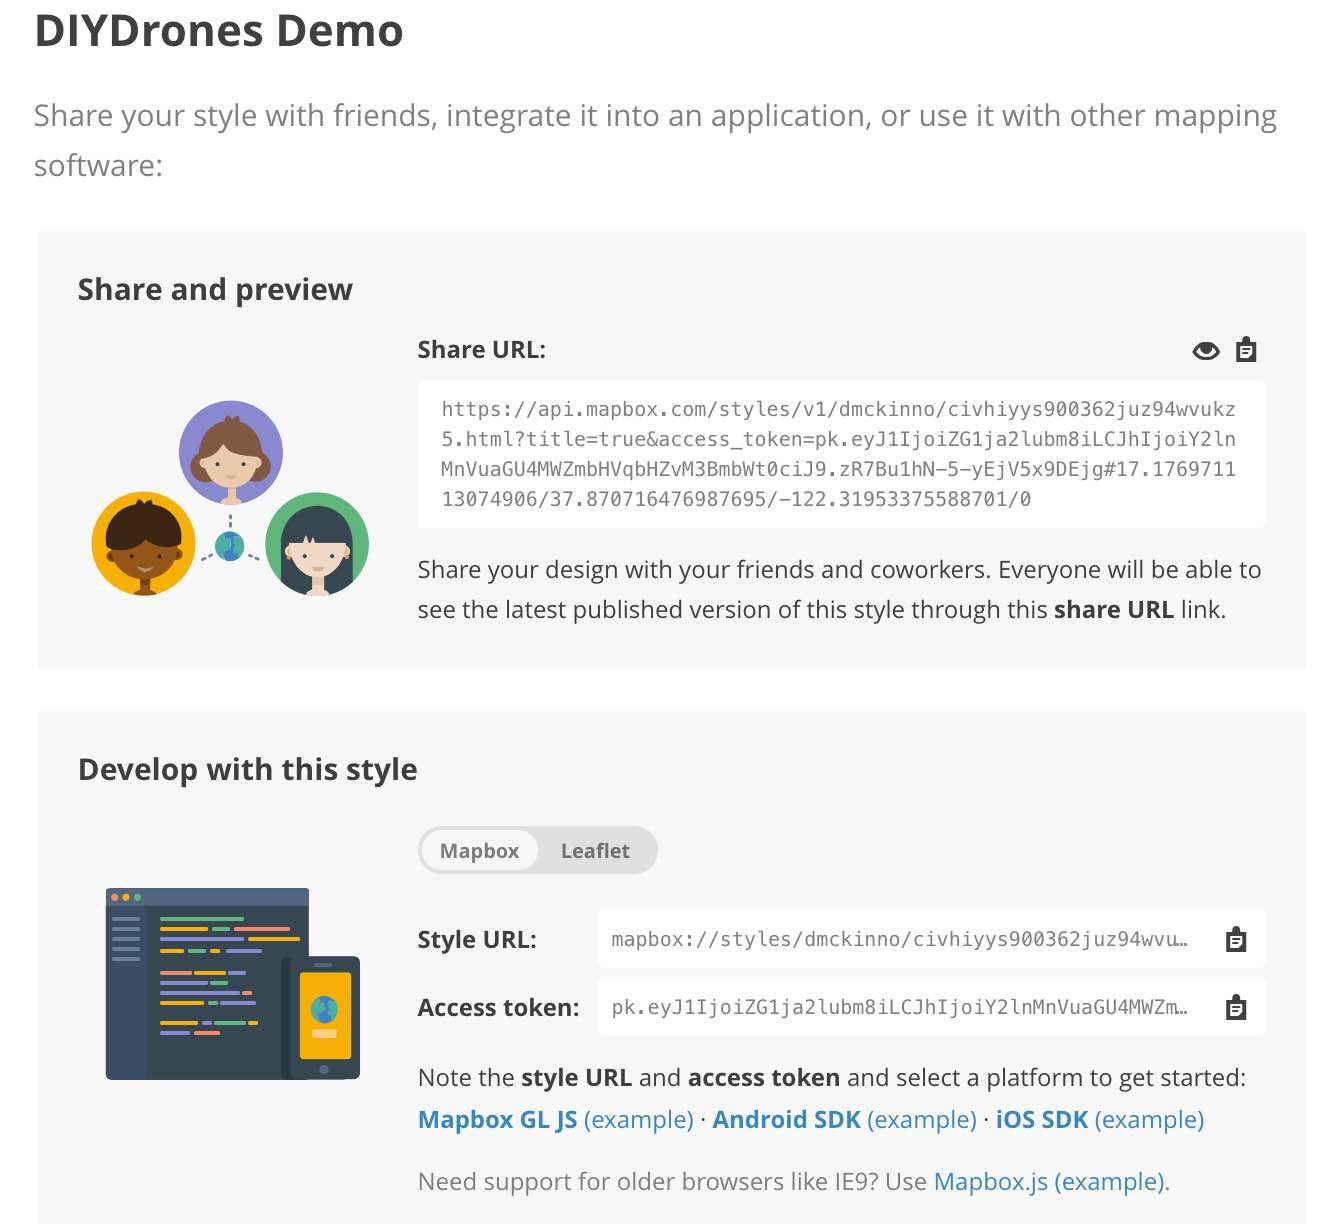
Mapbox will take you to the “Preview, Develop, and Use.” Copy and paste the generated URL and send it to all of your friends. This particular example is available here.

- Great! That’s the easy part. Static maps are nice, but Mapbox has a host of excellent examples that guide you in creating interactive maps displaying a wealth of different data types. First, the structure. Please clone my example repo at https://github.com/dmckinno/Mapbox to follow along.
Tilesets uploaded via Mapbox Studio cannot be manipulated by the user viewing them in the browser. To build the types of interactivity that I showed in the example above, you must write a few lines of JavaScript.Fortunately, this is quite straightforward and nicely mirrors the GUI options in Studio. To add a layer, use
map.on(‘load’, function () {
map.addSource(‘ortho’, {
type: ‘raster’,
url: ‘mapbox://dmckinno.8u0goq8l’
});
map.addLayer({
“id”: “ortho”,
“type”: “raster”,
“source”: “ortho”,
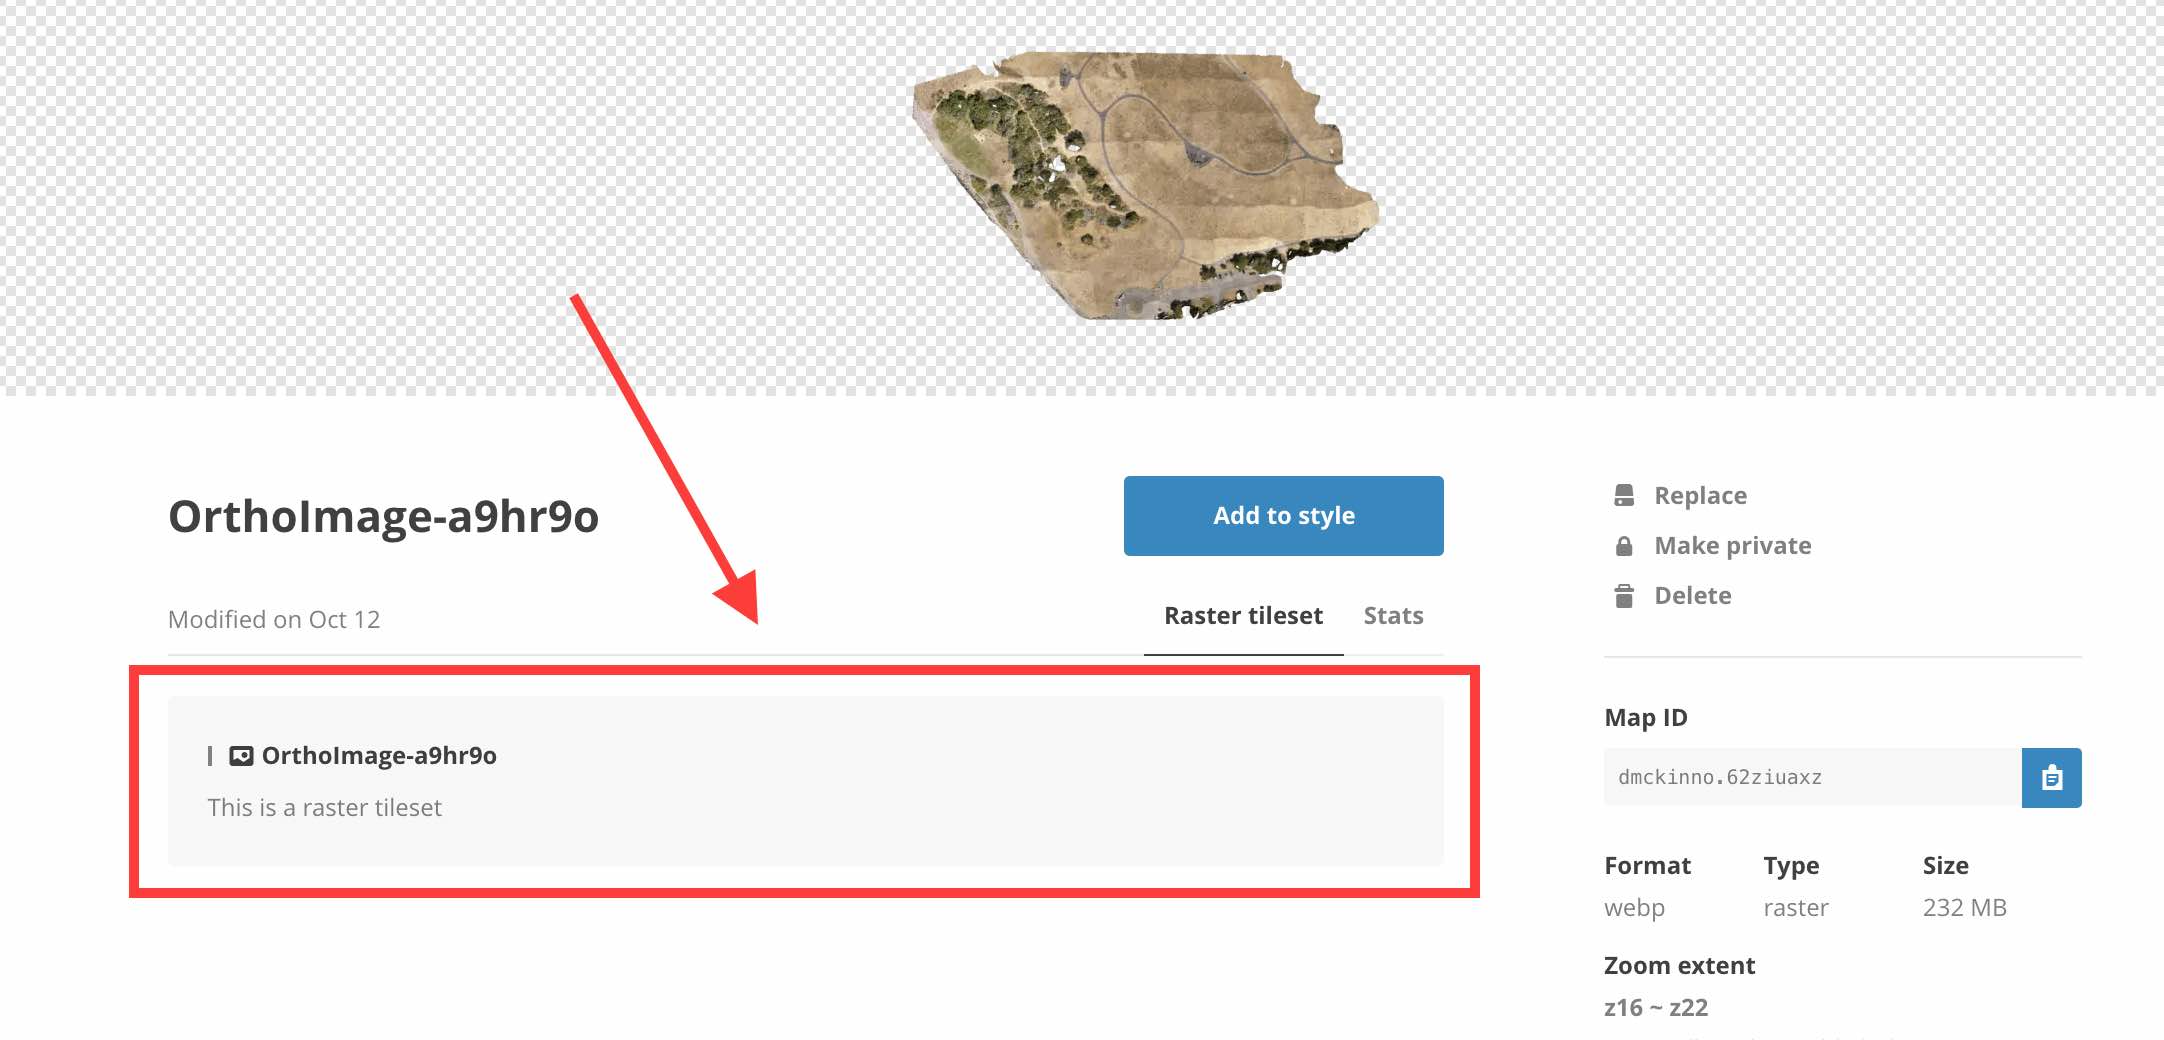
“source-layer”: “OrthoImage-6x2l6d”,
});
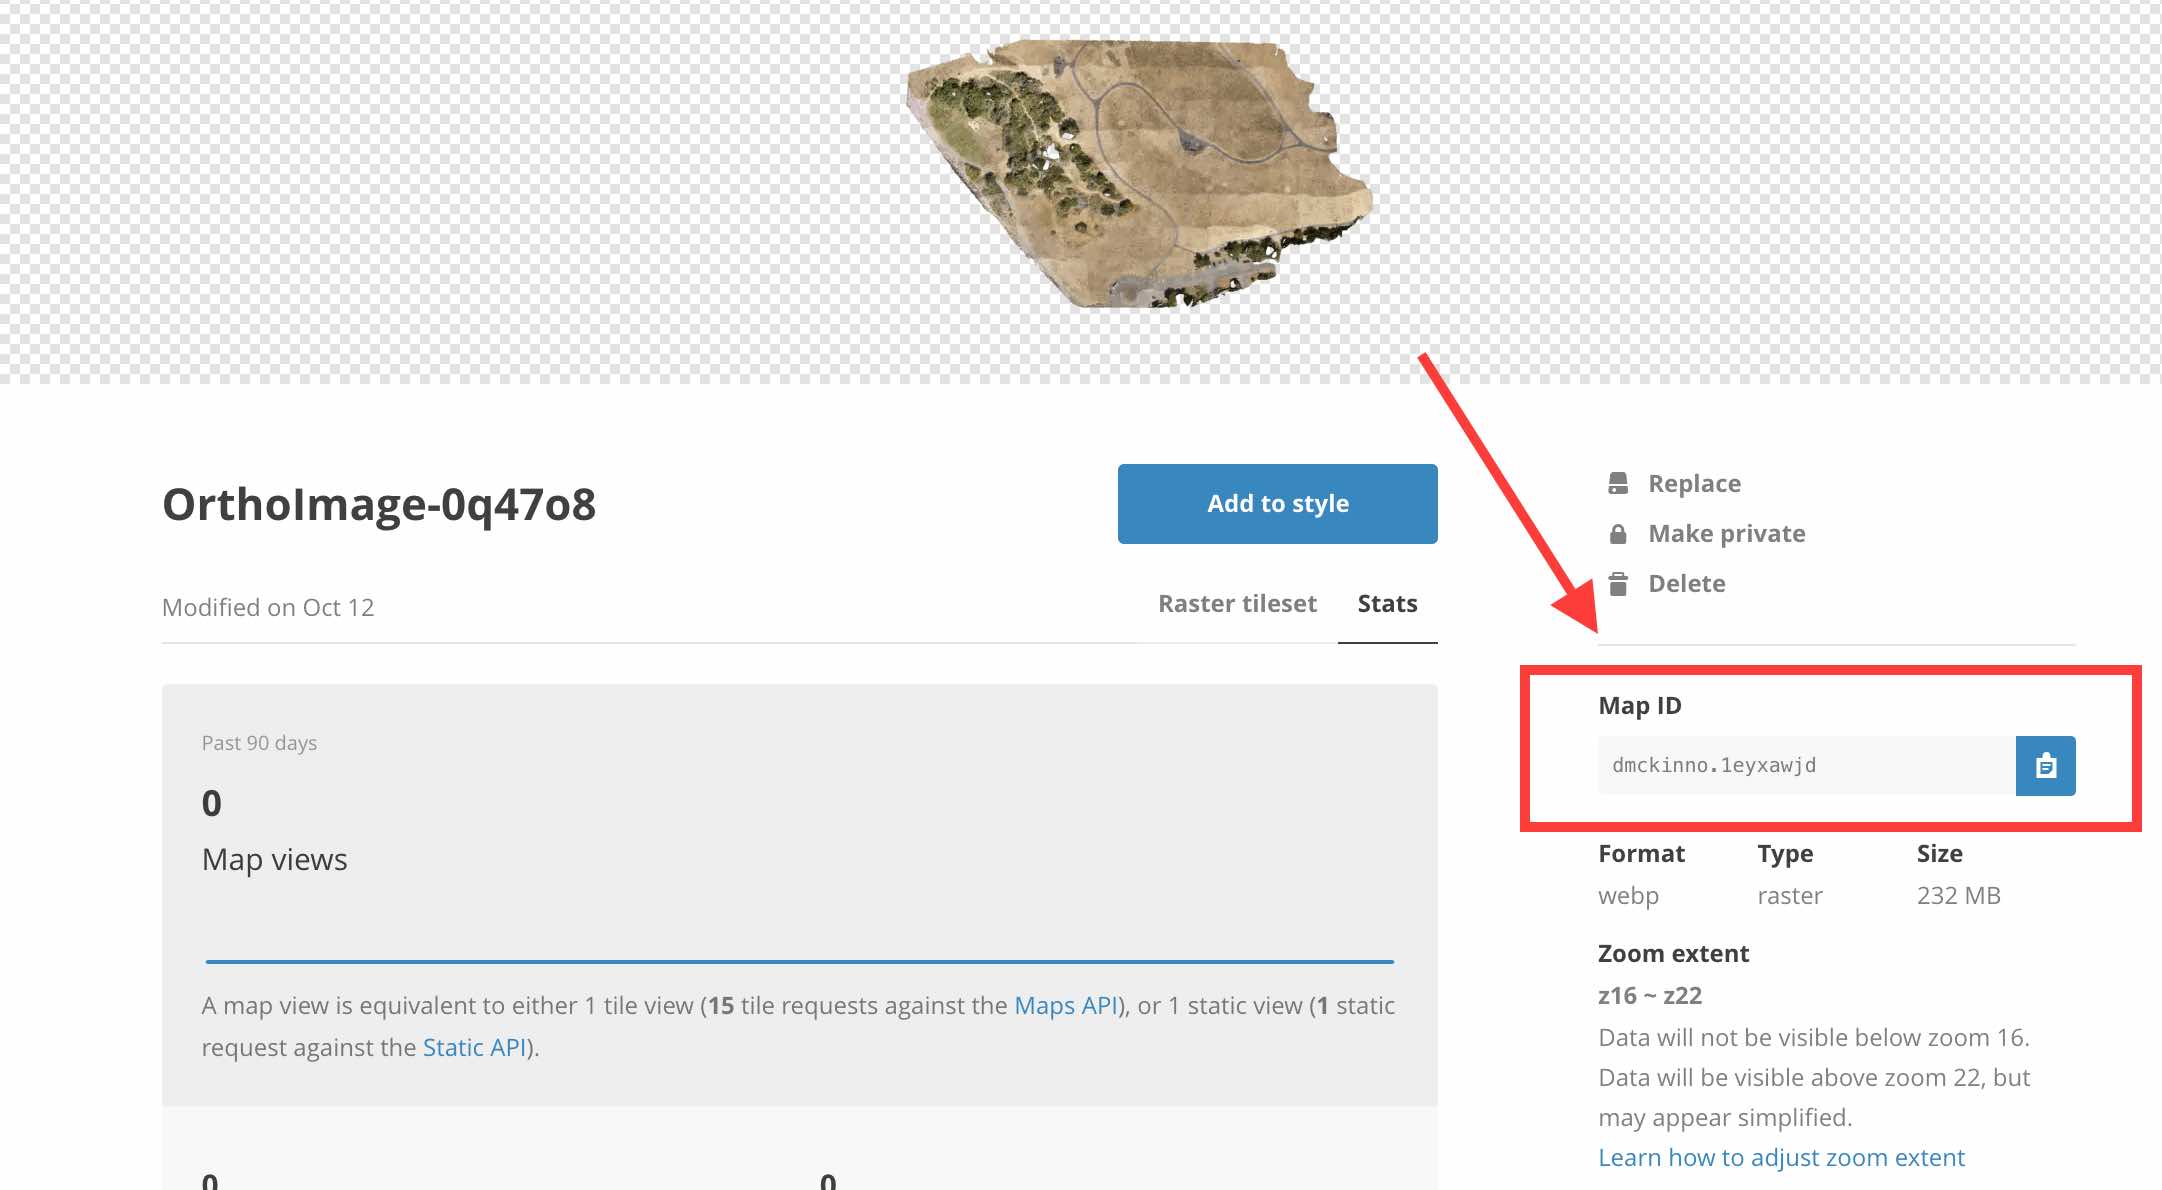
});This is a combination of the map.on and map.addLayer functions. I don’t know enough about JavaScript to explain exactly why they are both needed, but they are always together. I believe a layer is created and then placed on the map. In this case, I am adding a raster from a given Mapbox URL (this is creating by concatenating mapbox:// and the Map ID shown inside the tileset view) and placing it on the map with the ID “ortho.”

I always keep the source and the ID the same, but I’m sure some Mapbox wizard understands why they may be different in certain cases. The source-layer comes from the individual layer within the tileset. The is irrevelevant for rasters, but important if a vector tileset contains several different features. Nonetheless, the source-layer is available in the “Raster tileset” or “Vector tileset” tab in the tileset view.
Vector layers are added in a similar fashion.map.on(‘load’, function () {
map.addSource(‘views’, {
type: ‘vector’,
url: ‘mapbox://dmckinno.9erzotdj’
});
map.addLayer({
“id”: “views”,
“type”: “circle”,
“source”: “views”,
“source-layer”: “redhorse_photos-6besux”,
“paint”: {
“circle-color”: “#ffffff”,
“circle-radius”: 3
}
});
});
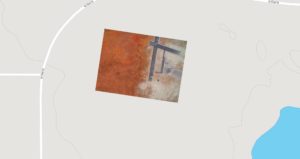
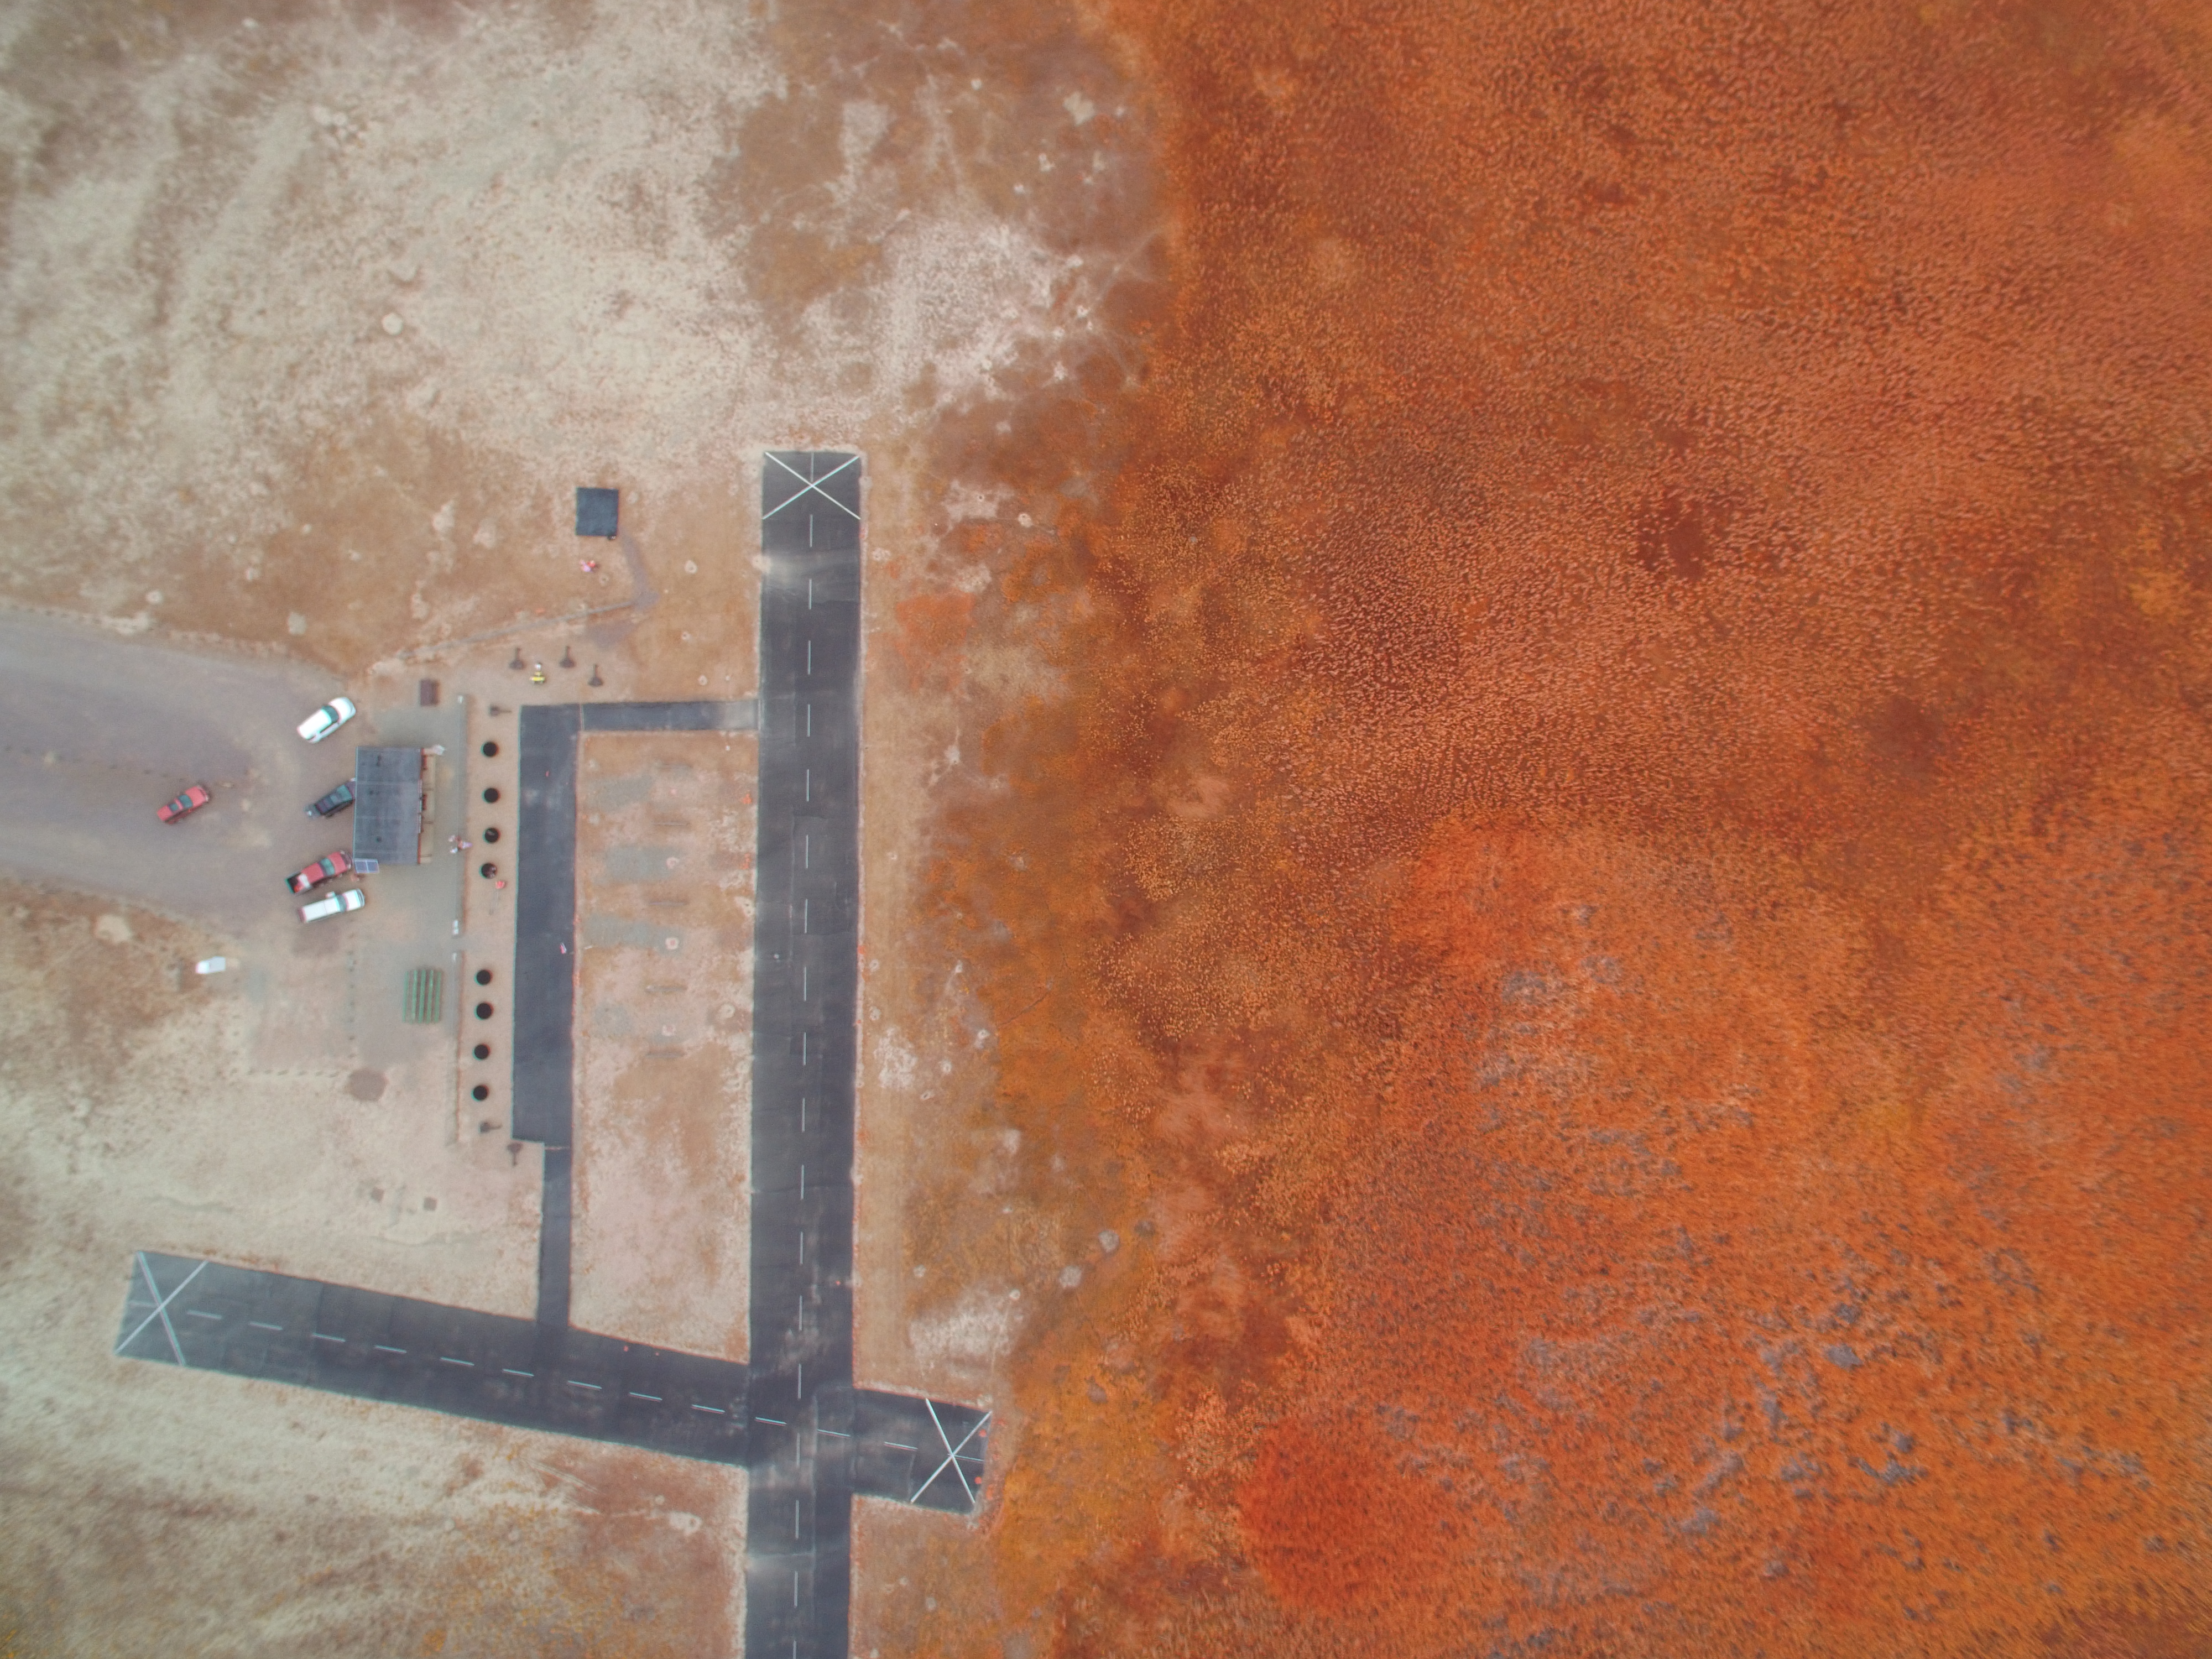
The only differences arise in the options available for displaying the data beautifully. Vector data can be painted with different colors, thicknesses, fills, and opacities. Here, I simply drew white circles that indicate photo locations, but more complex vector layers can be displayed in infinitely complex and beautiful ways. The Mapbox documentation walks through the options in painstaking detail. - Now you have your orthomosiac and raster data loaded, but you may want to augment the orthomosaic with individual nadir images. If you calculate the coordinates of the four corners of the image using the altitude of your drone and the focal length of the camera using simple geometry, you can display nadir images as psuedo-orthomosaics using the code below.
map.on(‘load’, function () {
map.addSource(‘photo1’, {
type: ‘image’,
url: ‘http://www.ddmckinnon.com/wp-content/uploads/2016/09/DJI_0202.jpg’,
coordinates: [
[-105.2311759, 40.0848768],
[-105.2335889, 40.0851527],
[-105.2333181, 40.0865392],
[-105.2309051, 40.0862633]
]
});
map.addLayer({
“id”: “photo1”,
“type”: “raster”,
“source”: “photo1”,
});
});It is somewhat challenging to embed two Mapbox maps in a single WordPress post (I use Code Embed, but please let me know if a better way exists), but an interactive map is available here and an image preview below. Note that because the image is not tiled, it is much less responsive than a true tiled orthomosaic.
- The final vector layer type you may be interested in displaying is a image locations. It is often helpful to show where images were taken on a map and be able to view them based on context, whether project appropriately on the basemap or not. To do this, you must create a .kml, .shp, or .geojson file from image EXIF data. If you only have a few images, you can easily do this manually, but if I would recommend using the exif-to-geojson tool for more than a handful.Once you have the geojson file containing all of the photo information, add a description field with the image URL and any text you like to each image. You can see another nice example of this in the map of my motorcycle trip.
“data”: {
“type”: “FeatureCollection”,
“features”: [{
“type”: “Feature”,
“properties”: {
“description”: “<img src=”YOUR IMAGE URL HERE”> and any text or links you like”
},
“geometry”: {
“type”: “Point”,
“coordinates”: [YOUR LONGITUDE, YOUR LATITUDE]
}
}]
} - Now that you’ve added all of your layers, you likely want to include some interactivity. I’ve played with all of the Mapbox examples, but most relevant here is the ability to show and hide layers and show images upon a click. For my example above, I copied and pasted from Mapbox with minor modifications and I recommend you do the same, making sure that you grab every line that you need.
- And voila! Now you have all the tools you need to share your drone data with all of your friends and followers using Mapbox and a few lines of JavaScript.


Comments
Thanks Daniel!!