Luke Wijnberg's Posts (3)

Sort by

9e3f098c10845026ff800fb5147e46c153b06b32_1_375x500.jpg

3DroneMapping has been testing a PPK system for the past year to integrate into our daily workflow. The point of PPK (or Post Processing Kinematic) is not just to improve internal photogrammetric model orientations, but also is general recognised as a way of undertaking full scale surveys at the same accuracy but without having to place time consuming ground control points. 3DroneMapping setup a calibration site to test the claims made by the manufacturers and ultimately for our own quality assurance that what we publish is indeed right the first and only time.

Ground control points traditionally have become a sore topic with RPAS aerial surveyors as they take time to construct, survey and verify. These points are needed in a much greater density than tradition aerial survey methods, due to the non metric cameras often used in RPAS. Locations where the terrain changes rapidly, homogenous surfaces, and densely vegetated areas all require a higher density of control points to assist the photogrammetric software to locate accurate ties points and stop the model from deviating. Undertaking a photogrammetric survey without control, can lead to disastrous results, as outlined in a previous article, “GROUND CONTROL VS NO CONTROL

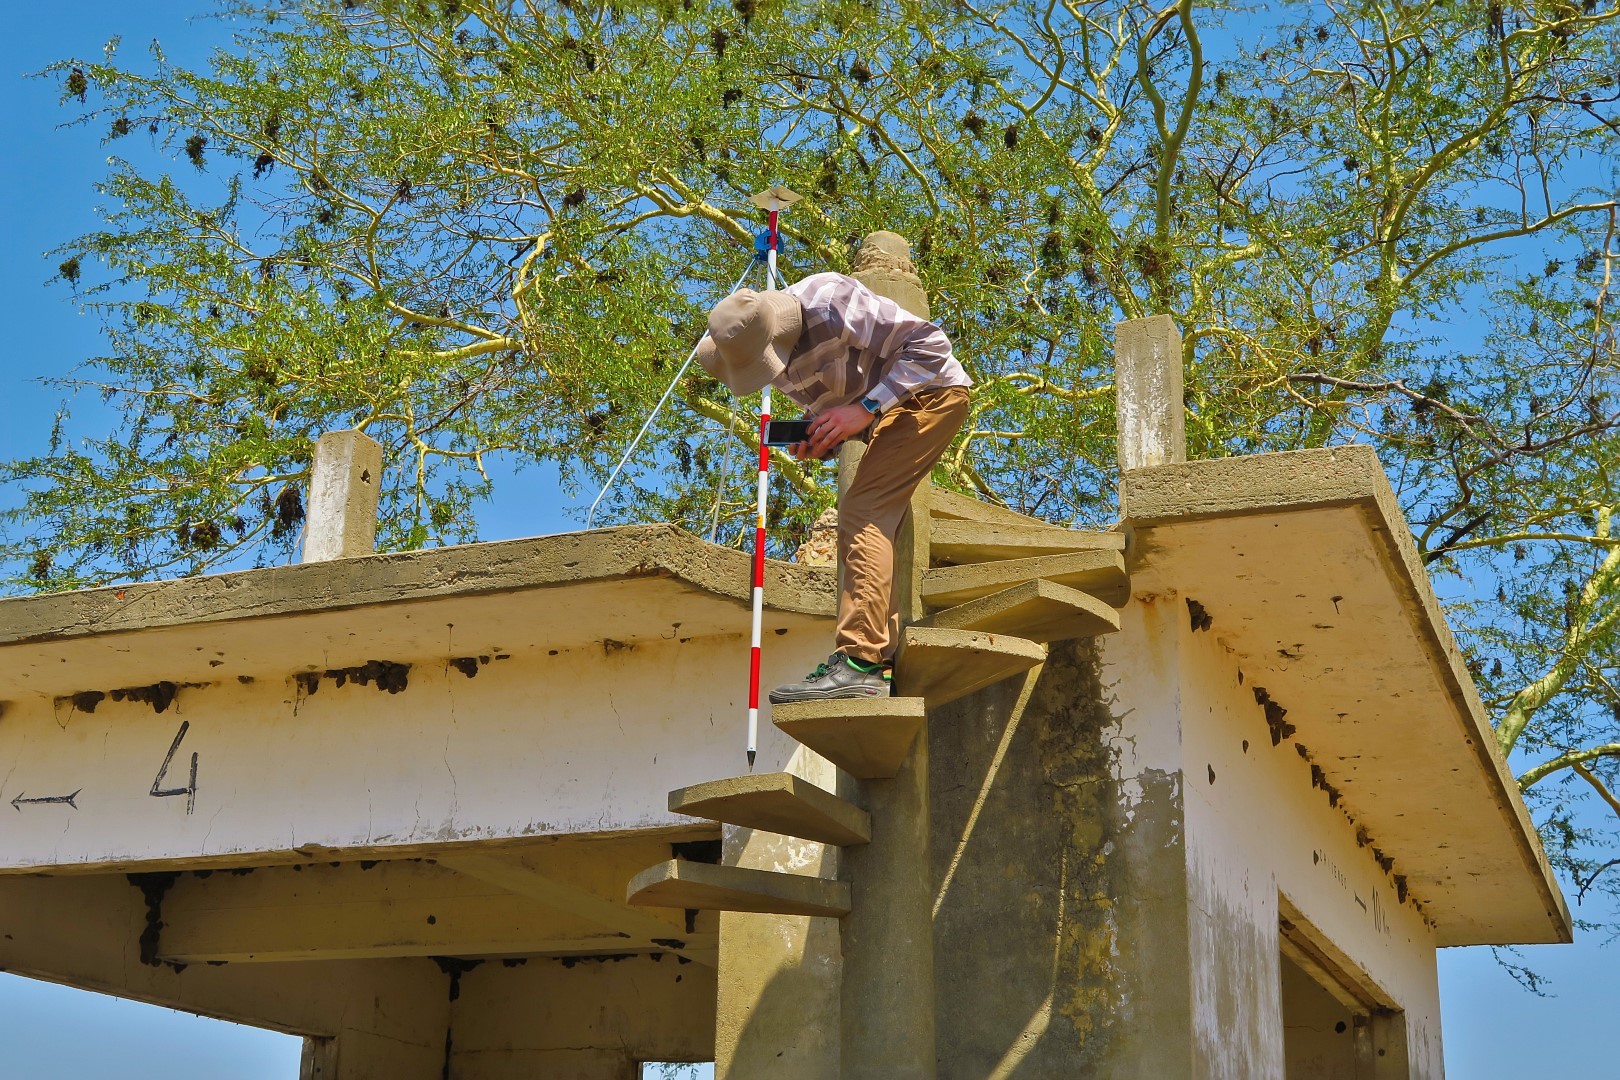
There are a number of issues with placing and surveying control points. The obvious one being that another piece of survey equipment is needed to accurately record the positions. This comes at a great cost as survey grade GPS systems can run into tens of thousands of dollars. Then the areas for the control need to be identified. These areas are often located at the fringes of the site to be surveyed as well as in the center. This means that the site needs to be traversed (often on foot) to place marks and survey them. In some cases it can take a few days to complete the marking for fairly small sites due to the terrain, vegetation, etc. Control points are also not permanent. They often go missing due to weather, theft for vandalism and cause problem for the surveyor back in the office when the surveyed points are not visible on the imagery.

Another problem with using control only for surveys using low level photogrammetry is that the consumer grade cameras used are not metric and are prone to distortion. While control can eliminate this to an extent, it is the areas between the control points that often are forced to fit alignment. This can lead to errors especially regarding heights.

Emlid has produced and excellent L1 only receiver that is sure to revolutionise the Small Unmanned Aircraft photogrammetry sector. Coupled to a decent camera with a good lense and sync cable, the setup allows you to undertake surveys to mean accuracies of less than 10cm. All that is required is a base and a rover (2 devices) that log the data for you in an easy to operate webviewer. No need for external communication radios, or fancy antennas, only a steady 5v supply like a battery bank.

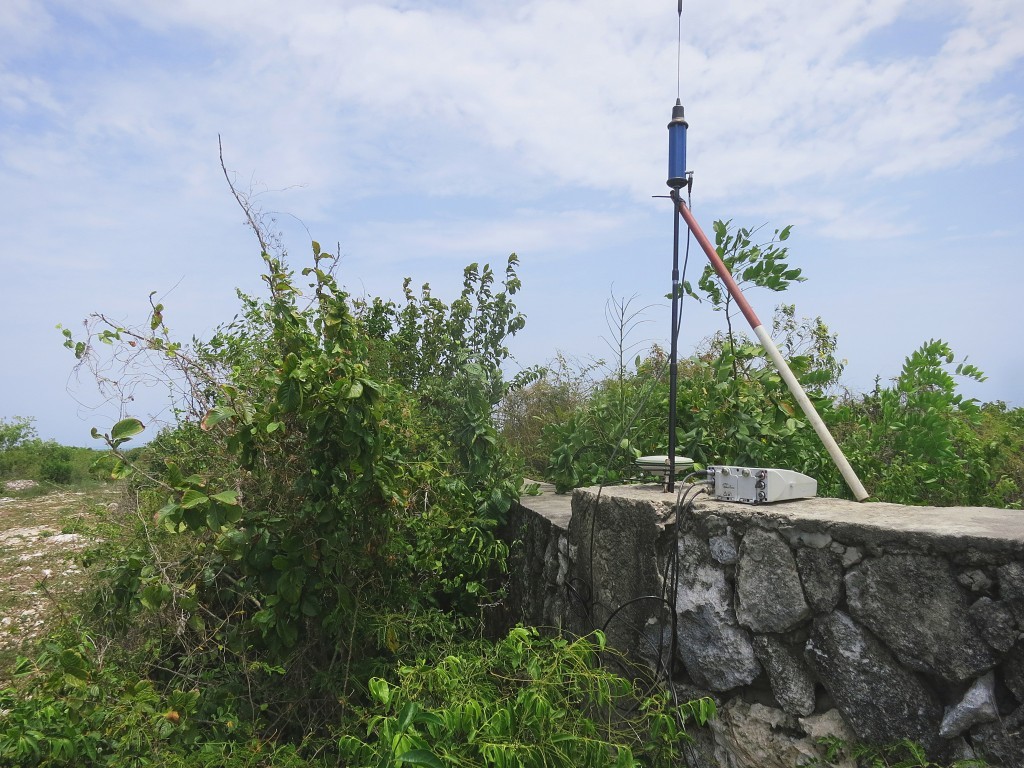
PPK is setup to have an accurate onboard GPS system that records a high frequency measurement tracklog of an RPAS flight. The system notes every time the camera takes an image and logs it. Another GPS is setup on the ground to record satellite information during the flight. Using a fork of RTKLibEmlid has developed their own flavour of this powerful piece of software that takes into consideration each time the shutter is trigger and records the position of that event. The timing of such an event is crucial, as a few milliseconds delay can translate to a few meters when operating at speed. The software compares the relative satellite positions between the devices, resulting are very accurate coordinates for each image captured.

The photogrammetric model generated from using PPK enhanced images gives a much more consistent and accurate rendering of the terrain. Tie points have a much greater certainty of intersection, speeding up the matching processes. This reduction in uncertainty means less resources are required, leaving an opportunity to increase the density of other processes like point cloud generation, geometrically verified matching, etc.

Trials for PPK testing for 3DroneMapping began 3 weeks ago with a test calibration site. Over 200 tradition ground control points were surveyed over a 780ha site, some of which were placed in very challenging positions that like close to tall structures, under power lines, close to dense vegetation and visibly homogeneous surfaces. The control points were placed over 18 months and maintained. The site was flown over a 3 week period with a number of flights and post production methods to determine the optimum settings and processing requirements. At the end, the most consistent and repeatable results were chosen for the optimised settings for the end survey requirements and RPAS setup.

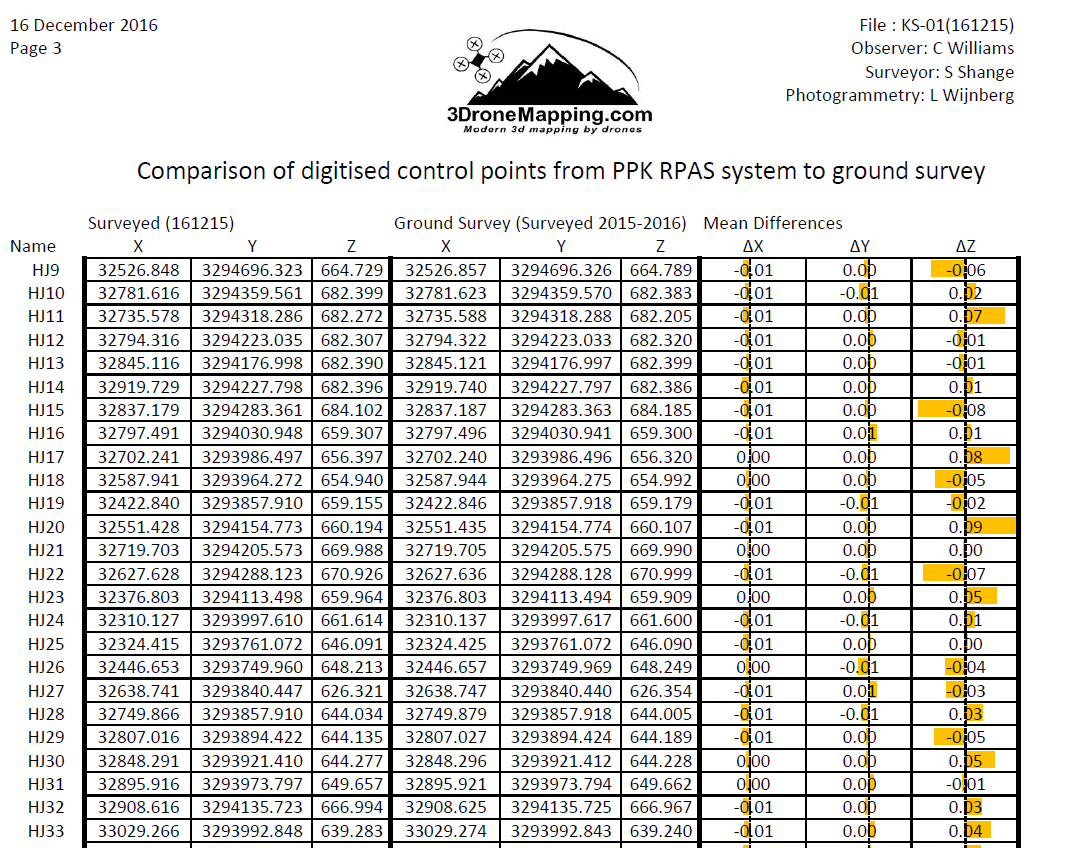
Control points were digitised from resulting point clouds and orthophotos and compared to the previously surveyed. These positions showed almost no difference to the control as published. Areas that have previously been a problem for photogrammetry showed up even and consistent between surveys when drawing profiles or cross sections. The 200 control points varied only a few centimeters over the entire site giving a very accurate and tight model.

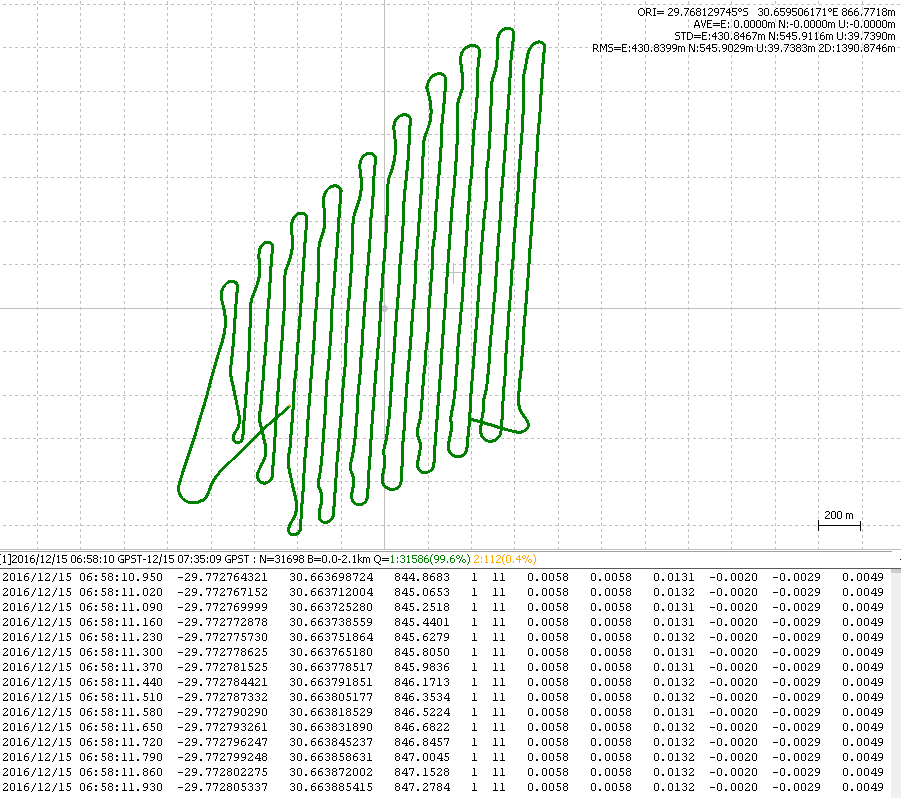
The final fieldbook and comparison for the survey can be found here:
As a brief synopsis of the results, the maximum deviation of points was no more than 0.09m in all axis. This is an incredible result given the fact that the average pixel size of the resulting imagery was 0.045m. It is interesting to note that the average mean error in all axes is 0.00m! But this is meaningless as it is an average across the field. The maximum deviation measured between session as a profile or cross section indicated almost no shift at all, meaning that the data is consistent between sessions. This is close to impossible under normal operations with ground control points.

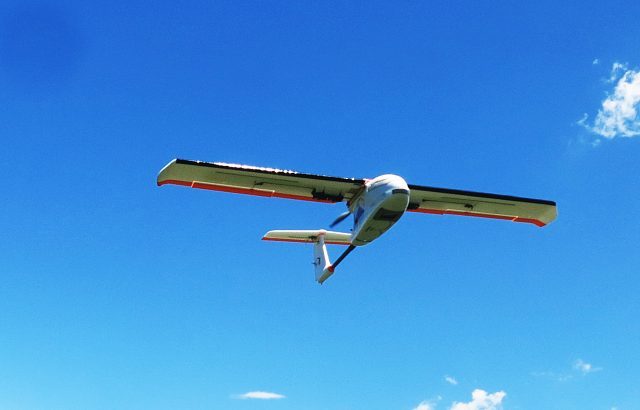
The aircraft used was a fixed wing RPAS carrying a Sony camera with fixed focal lense A total of 836 images were collected at 800ft AGL, with a 68% side and overlap. The test area is 780ha big and takes 45-55 min to fly at an average speed of 19m/s. The Reach was recording data at 14hz, GPS only. The ground survey completed with Leica GPS1200 checked measurements to 0.02m horizontal and 0.03m vertical accuracy with all points checked and meaned

  • PPK setup using Sony A6000 camera, 20mm lense, EMLID Reach with flash sync, Tallysman TW4721, ReachView beta v2.1.5
  • PPK base running EMLID Reach, TW2410, ReachView beta v2.1.5
  • PPK post processed in RTKPOST ver2.4.3_Emlid_b26
  • Photogrammetry done in Pix4Dmapper Pro Ver 3.0.17
  • Orthophoto resolution 0.043m, point cloud resolution 47.1 points per m³
  • Comparison digitised in ArcGIS V10.0
  • EPSG:2054. Hartebeesthoek94 / Lo31

What this all translates to is that surveys can now be undertaken with even less time spent in the field and can result in even more accurate and consistent data. But should you not place control at all? This is a bad survey practice as you are depending on only 1 set of data measurements. As a caution, we would still place only a few control points as a quality assurance test to prove to yourself and others about the precision of the data generated.
But you do not need to buy or hire a GPS for this as the very same Emlid Reach in the aircraft can be used to survey those control points just as accurately!


9d3de5c1f84b03caee814d4c1e37235c3f337361.jpg

Read more…

Emlid Reach for placing GCP

3689682238?profile=originalWe have been using the L1 only Reach GPS from EMLID for about 2 months. We were first attracted to the fact that it claimed that it was going to be integrated to Pixhawk and would then, via a system of magic, give us centimeter accurate geotagged images, eliminating the need for ground control forever.

While we wait for that to become a reality, we have tried out the Reach as a replacement to our normal survey grade Leica GPS1200. We wanted to see just how accurate and robust the Reach is and whether it could be consider a tool for the budget aerial mapper to make more meaningful and accurate models. Despite our office being skeptical of L1 only GPS to give less than decimeter results, we were surprised at the robustness of post processed L1 data.

Our first major project using the Reach was in Zanibar, Tanzania early February 2016. The Reach was used to create a high accuracy GPS tracklog onboard a boat, to be coupled with sonar data, creating a medium accuracy bathymetric survey. Despite the antenna flopping over during the survey, some usable results were obtained. The full story can be read here: 3DroneMapping report

3689682371?profile=original

More recently, we attempted to create a workflow and benchmark test to adopt the Reach as our main surveying tool to place GCP. Having a Leica GPS1200 survey grade GPS has been great for all our projects, but lugging 30kg of additional hardware especially in remote places in Africa, as well the worry of transporting $60 000 worth of gear is a headache. As our workforce continues to grow, it is getting harder to afford such devices for all the teams to use. Placing GCP to a few centimeters is actually a simple process when you remove the RTK element and the Reach seems to do this just fine for us as well as having some other features baked into it for future use like IMU and Pixhawk integration.

The site chosen for the comparison is an active construction site near to Durban, South Africa. Points were surveyed by our office 3 months ago via a Leica GPS1200. The points have been semi permanently marked with road marking paint on tar, plastic bags arranged in "X" formation and other ways, making all points visible from the air for photogrammetric uses. The points were initially measured in RTK and then confirmed with a local NTRIP VRS server. The survey is based on the VRS coordinate system, Hartebeesthoek94 / Lo31 (EPSG:2054).

We wanted to test the Reach in 2 ways. The first being via RTK ways and then by post processing. A total of 3 Reach devices were used. It was decided to not use the Reach with an attached RFD900 radio. Previous tests have shown that the radio range, even at maximum power output, is not really useful for terrestrial work. We suspect that the polarization of the antennas is best suited for ground to air communications. It as then decided to send RTCM data via a TCP server, connected to an ADSL line(via a WIFI router)

3689682463?profile=original

The first Reach was installed at our office, 3km away from the site. This Reach, "BASE1" was to act as a reference base. The Reach was connected to the office WIFI and assigned a static IP. The antenna was installed on the roof of the office with a 300mm x300mm metal plate acting as a ground plane. The Reach was connected to our VRS and a coordinate was determined within 20 seconds. The point was averaged for over 30 seconds. This point occupation would form the basis of our control system making it easier to compare to the true system.

"BASE1" now had a coordinate, and was set to "Base" mode. The coordinate entered in the respective fields, the output set to "TCPServer", GPS and GLONASS data was sent at 1HZ. Before leaving the office, we tested that the data stream was accessible from outside of our local network via the Android app "Lefebure NTRIP Client"

On the site, "BASE2" was installed. This consisted of an antenna being installed on a 300mm x300mm metal plate acting as a ground plane, in an open area, elevated on a wooden fence post. The Reach was connected to a portable WIFI router, in turn connected to a public 3G service. The portable WIFI router was used as an access point to use Reachview as well as the internet. A Androind cellphone was also connected to the mobile WIFI network and Reachview accessed via Chrome browser. "BASE2" was initialized with the default Reach settings and configured to use "BASE1" via TCP client. After a 15 seconds, a solution was derived and stored. Reach was then placed in the default "Single" mode with GPS/GLONASS satellites being used at 1hz. The data being stored onboard.

Various points were then surveyed about the site. The 3rd Reach was setup on a 2m pole. The antenna placed on a 200mmx200mm sheet metal plate, and a plumbing bubble installed on the pole to ensure it was held vertically over every point. The point was located and then the pole/antenna positioned over the previously surveyed mark. The Reach was placed in the default RTK mode but "Static" was the operation of choice as the antenna would not be moving during the observation window. RTCM data was being received from "BASE1", all raw observations were being stored as well as the solution. The measurement windows lasted for 60 seconds per point, at 1hz. Most points had open clear view of the sky about them, but 2 locations had high tension power lines overhead, which made for some interesting results. The starting points were measured at the end of the survey again to ensure that the base had not moved and to test the integrity of the data.

After each point was measured, the base was retrieved and the data downloaded. Rinex files were determined for "BASE2" and for each of the measurements. The solutions calculated in the field were collected and tabulated ofr each point. The TCP measured data collected from BASE1 was also tested via RTKLIB v2.4.3 b8. The exact same result was created on a PC via post processing from BASE1 to what was determined in the field.

Post processing from BASE2 yielded much better results. These were tabulated and compared to the original values from the Leica GPS. The configuration used to calculate the positions was the default RTKLIB settings, using Static modes and a single solution derived.

3689682425?profile=original

3689682387?profile=original

In the table, the X,Y,Z,dX,dY,dZ columns are in meters, the coordinate system being Hartebeesthoek94 / Lo31 (EPSG:2054). These were calculated from the raw processed WGS84 coordinates in ArcGIS and the South Africa geoid model applied to obtain orthometric heights. The "Original" columns are the the Leica GPS1200 surveyed and adopted results as true sub 30mm accuracy.

As can be seen, there are a lot of inconsistencies with the TCP data stream corrected solutions from "BASE1". However, when compared to the PP solutions of "BASE2", the results really do appear favorable and perfectly suitable for placement of GCP.

This is a really accurate result from such affordable and simple hardware. Using proper survey techniques and understanding what is going on with processed GPS data helps a lot in getting the best from these devices.

We conclude that:
- Post processing is really robust and works well to getting good results, especially regarding heighting

- There are a few latency issues with using a TCP server. We think that in our case, having the data being streamed at 5hz from BASE1 > Router > ADSL > Internet > 3G > Mobile WIFI > Reach is a bit long winded causing data delays / loss.

- 1hz is perfectly fine for static observations. For post processing, good measurements come from long observation windows and not the amount of raw data used to process with.

- Having a good ground plane helps a lot to reduce multipath as well as having obstruction free view of the sky.

- L1 only is not that robust and the control point areas need to be carefully considered to reduce multipath and long baselines

- It would be really great if coming versions of Reach could also allow for raw observations to be recorded while in "Base" mode. These could be used as a back up if the communication goes down between units as well as offering a more more robust solution possibility.

- The RTKLIB method is a bit painful when it comes to multiple points as there is no way of assigning a name to an observation. One needs to alternatively log the time and name / details for compiling a coordinate list. Each point needs to be individually processed, taking time.

- A set of Emlid Reach GPS units (at less than $600 for a pair!) is perfectly fine to place sub 50mm accuracy control points for UAV photogrammetry.

Device Setup is as follows:
BASE1
Reach running Reach image V1.1, Reachview V0.1.0
Powered via 5v DF13 at 2ah
Tallysman TW-4721 placed on 300mmx300mm sheet metal, unobstructed
Conected via WIFI/4mbps internet ADSL connection
Static IP TCP Server
Broadcasting RTCM data at 5hz

BASE2
Reach running Reach image V1.2, Reachview V0.1.0
Powered via 5v USB at 2ah
Tallysman TW-2410 placed on 300mmx300mm sheet metal, unobstructed
No internet / WIFI connection
Recording raw data at 1hz

Rover
Reach running Reach image V1.2, Reachview V0.1.0
Powered via 5v USB at 2ah
Tallysman TW-4421 placed on 200mmx200mm sheet metal on 2m plumbing pole
Mobile WIFI connection via 3G for Reachview / TCP client
Recording raw data at 1hz

Read more…

Aerial Survey in Uganda

3689611854?profile=original

Mark Wijnberg Land Surveyors recently completed an aerial survey of a river valley in a remote section of Western Uganda. The area is found on the Eastern slopes of the Rwenzori Mountains, close to the Congolese border. The purpose of the survey was to determine the feasibility of the construction of a hydro-power plant and its environmental and social implications. The survey area dimensions were approximately 7km by 3km and the altitude varied over 350m. Other specifications included orthoimagery, DTM of 0.25m spacing, 0.5m contours, a hydrographic survey of the river profile, installation of various benchmarks and all data represented on an AutoCAD drawing.


The terrain is very mountainous. It seemed to rain nearly every day which made climbing up steep muddy slopes exhausting. The jungle consisted of thick vines and dense vegetation. Much of the site is under cultivation of plantain, coffee and cassava. Many, if not all of the residents, had not encountered a white person before and many of the forest dwellers had never crossed the river to "civilization". There is no electricity, piped water nor sewerage for 100km.


Upon arrival in Uganda, we obtained permissions from the relevant authorities to gain access to the region. Without this permission, we were warned that if caught on this land, we would be assaulted by the army and questions asked only after we were dead! We sought council from local surveyors as to the best method of operation. Our first job was to establish a control coordinate system. As the closest markers giving a global reference system were approximately 2

3689611665?profile=original

00km away from the site over very rugged terrain, we decided to post process raw GPS data, collected at 10 second intervals over an 8 hour period. This task was done with a Leica GPS1200 receiver and then uploaded to Trimble RTX post processing option to derive an ITRF2008 coordinate. The results achieved were at 99% confidence level which was suitable for our survey. The coordinate system was also check against OPUS base stations over 3000km away which agreed to within a few centimeters. The orthometric levels were calculated using the EGM2008 geoid model. Once we had determined "where we were in the world", we could begin with the placing of the control benchmarks and measuring them as accurately as

 0.005m in all dimensions. The benchmarks consisted of 25 control points equally spaced over the site. These were time consuming to construct as our client insisted that they be 0.3m x 0.3m x 0.3m concrete blocks with a 0.5m iron bar inserted though the center. This necessitated us to hire local laborers to carry the 100kg of cement, aggregate and iron bars by foot though steep, slippery jungle. These benchmarks were also adopted for GCP for the aerial survey by placing whitewashed stones around the marks in a "T" fashion. A further 80 spot checks were made to check against the final product.


The client also required a survey of the river basin. The river averages 1m deep and flowed fairly fast. Over the 7km length, the total drop was 280m. These points were measured with GPS manually and we not only did a measurement of the channel depth at 15m intervals but we showed the channel sides and banks. This was a job that unfortunately the UAV could not measure as all points were under water. Areas that were densely vegetated we also surveyed manually as we needed to indicate the natural ground level. This required a lot of manual labor to cover this type of terrain. It is estimated that a total of 25km a day was walked with 1km vertically gained.

 3689611875?profile=original

During the ground survey, a suitable site was searched for to launch and monitor the drone for the aerial survey. A school ground was found to be best suited for launch and landing. It also aligned well with the prevailing winds. It was noted that the winds blew every day from a South Easterly direction. The wind formed in strong gusts of 5 minutes followed by 20 minutes of calm. This is attributed to air rising of the Crater Lakes area rising up towards the Rwenzori Mountains. It was decided to do the survey early in the morning before the winds began. On the day of the flight, cool, calm and overcast conditions were experienced. The overcast conditions were appreciated as this reduced the contrasting effect of having strong sunlight causing shadows from elevated features. The residents of the valley were also asked to refrain from burning to reduce the smoke and haze during the proposed survey dates.

 3689611807?profile=original

The UAV used is a 1.8m fixed wing, 2014 Skywalker frame with 2.6 APM, RFD900 long range radios, 10ah 4s battery. The camera used is a Canon S100 with an intervalometer script set to record a frame every 3 seconds. This was all kindly supplied by the gentlemen at event38.com. The flight plan was designed to accommodate a 75% sidelap and a 93% frontlap. The reasoning behind such a high sidelap was due to such large changes in elevation in the terrain. This was decided to best cover the location. The high front lap provided redundancy against those images that could not be used due to high rolling, blurring and banking shots. The total flight distance was 56km and the time taken from launch to landing was 1.3 hours. Landing was not as easy as previously thought as a large crowd had gathered shortly after the launch and refused to leave the landing strip upon the return of the UAV from its mission. The landing could best be described as "crowd surfing!"

 3689611689?profile=original

A total of 1700 images were recorded. A few of these were discarded due to poor quality or non-vertical orientation. Despite the encountered haze, clear images were obtained. A brief overview of the images indicated that extra areas required manual survey to obtain a ground level for the clients final DTM. The images were processed using Agisoft Photoscan and then referenced using the control points previously recorded. These control marks appeared very clearly in the imagery and due to good planning, an even spread of control over the site strengthened the final image block. The maximum residual was found to be 0.03m over a 7km by 3km area. The spot checks manually measured compared very well to those reconstructed by photogrammetric means.

 3689611896?profile=original

The final processing of the imagery to produce a 0.06m pixel orthophoto and a 0.2m DEM took an Intel i7 processor with 16GB of RAM 11 hours to render. The final image was cut into 500m x 500m blocks to reduce the images size for the client. The DEM was imported to ArcGIS. This allowed us to remove those points manually that did not fall part of the ground level and also those from the river surface. The manually surveyed GPS points were then inserted into the edited DEM and triangulated. This filled the DEM to give and smooth, seamless coverage of the site. Contours were generated to the required interval and checked against the imagery as a backdrop. The other features that formed part of the topographic survey such as dwellings, footpaths, limits of agriculture were digitized from the imagery and exported to CAD format with the contour information. From the measurements taken from the river, cross sections at certain strategic locations could be drawn as well as long sections detailing the fall over distance of the river.

 3689611911?profile=original

In summary, this project combined both old and new worlds in terms of survey. The Ugandan surveyors that assisted us come from very challenging conditions where electricity is a luxury, and transport is dangerous if not impossible at the best of times. From comparing their typewriters to our laptops, their bicycles to our 4x4 vehicles, from their theodolite to our GPS, the usage of UAV must seem like something out of science fiction movie. The surveyors that we encountered and employed (often very well educated and experienced) were very excited by this new technology and were attracted especially by its seemingly affordability and ease of use. We estimate that this project would have taken us 0.5% of the time it would have taken to manually survey the entire region to the required detail. And even if traditional aerial survey methods were employed, it would push the cost far beyond the reaches of a simple feasibility study. The total time taken to produce the final goods has shocked our client who was expecting the final delivery to take place 3 months from the date of instruction. We managed to finish the project in 29 days. The UAV has again proved itself a very valuable and accurate weapon in the surveyor’s arsenal.

3689611967?profile=original

3689611988?profile=original

3689611828?profile=original

Read more…